Marketing is part art, part science.
Creativity drives us all to find new ways to bring products and services to the right people. We create compelling copy. We design stunning graphics. We craft intuitive user interfaces. We mold intelligent strategies.
As Mike Volpe, chief marketing officer for Cybereason and former HubSpot CMO, puts it: “You want a mad scientist” to run your marketing.
But how do we know when our bold ideas work? How do we make sure we’re spending our time creating on channels that matter? How do we put the scientist in “mad scientist”?
Savvy content marketers use an experimentation mindset. This doesn’t mean giving up on creativity to be ruled by hard numbers. It means being able to measure the impact of your big plays and – most importantly – figure out how to capture that lightning-in-a-bottle again.
One of the best ways to understand how and why certain aspects of your content marketing work is to employ an A/B test, or a split test.
In short, these tests pit one variable directly against another to give you a quick, in-context understanding of the decisions your users make.
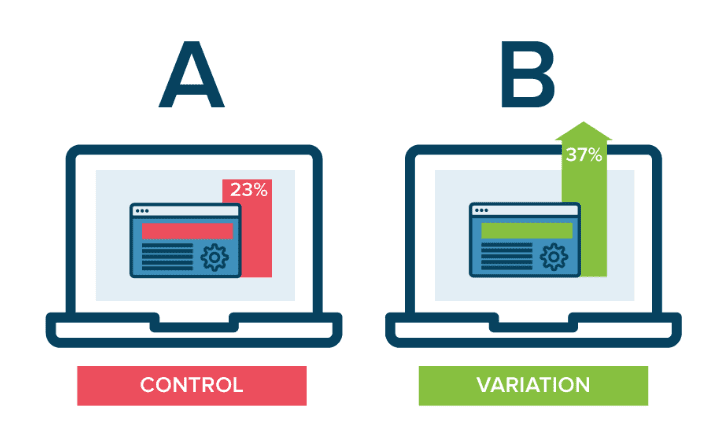
Source: Optimizely
For example, each option is presented to half your visitors:
Option A: green call-to-action button = 19% clickthrough rate
Option B: red call-to-action button = 31% clickthrough rate
A/B tests can help you leverage lots of small gains and optimize every element of your content marketing funnel.
Even if every test only helps you increase your conversions a few percentage points, that adds up across your entire funnel.
How to Set Up Scientifically and Statistically Sound Split Tests
You’ll need to keep a couple sets of principles in mind as you prepare to test your variables:
Statistics and the scientific method.
If neither math nor science was your favorite subject in school, no worries – creating a marketing split test involves no TI-83 graphing calculators or Bunsen burners, just a little borrowing from those disciplines.
Ensure Reliable Results Through Statistical Principles
The first thing you need to conduct worthwhile A/B and split testing?
Enough conversions to matter.
Or, enough traffic/clicks/signups/etc. to ensure statistically significant results, which help you decide whether making the change reflected in the experiment will really turn into results for you.
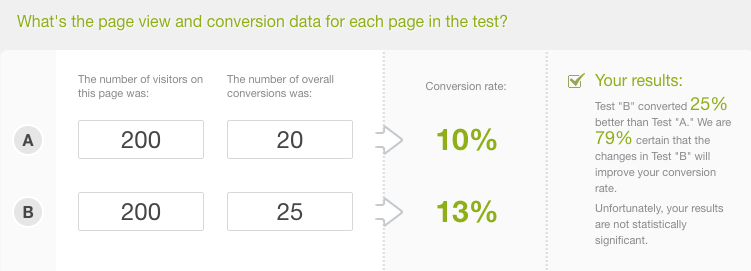
Let’s say you want to test a green CTA button vs. a red one. But, you’re in the early stages of building your audience, and traffic’s pretty light. During your A/B test, you only get 200 visitors. 20 of them click the green button and 25 click the red.
On its surface, that looks like a “win” for the red button – it converted at 13% to green’s 10%, after all. But when you’re looking at such low traffic numbers, there aren’t enough instances to translate into a reliable result.
Kissmetrics has a handy A/B Significance Test calculator to help you quickly understand if you’ve achieved statistical significance. This is what our hypothetical test looks like on the calculator:
Kissmetrics also produced a post called, “Most of Your A/B Test Results are Illusory and That’s Okay” about why marketers abandon their tests too early out of impatience. It’s worth a read in full as a cautionary tale for taking adequate time to plan everything – including how long you’ll run the test and whether you even can based on your numbers.
Base Your Experiment Around the Scientific Method
Remember the Scientific Method from school? This set of techniques helps you keep your tests systematic and measurable. Staying in the mindset of an experiment helps give your testing a framework.
The basic structure of the scientific method asks you to:
- Define the purpose of your experiment
- Develop a testable hypothesis
- Understand the variables involved
- Eliminate any potential biases that might affect variables
- Develop a repeatable experiment
- Gather data
- Assess results, and
- Modify, refine, or alter your original conjecture based on those results
…it’s pretty much the perfect framework for an A/B test!
Content Marketing A/B Tests You Can Conduct
Not everyone has enough traffic to conduct all the content marketing split testing that make sense.
If you have enough traffic, you can test almost anything that you can set up against another variable. Whether you should test something or not depends a lot on your goals for your content marketing and the performance of your content program.
If you do not have enough traffic to test anything you might want to test (as mentioned in this Copyhackers piece, ConversionXL’s Peep Laja recommends you have 250 conversions for each element of your test before you have statistical confidence – so 250 clicks on each version of a CTA button, etc.)…then you should test what you can.
Testing what you can even if you don’t have enough traffic to test some of the things you’d like to test accomplishes two things:
1) You build a culture and habit of testing, which allows you, in turn, to contextualize “failure” and learn to act based on data
2) You can grab those incremental gains as your traffic grows and build a better-optimized funnel as you go, rather than waiting for a magical traffic number.
You can “triage” your testing needs to prioritize them:
- Test the things that seem broken first. If your email marketing has stagnated or you’re seeing major issues getting people to stay on your articles, then pull those tests to the front of the list so you can figure out what’s going wrong.
- Set up testing for items that seem like they could use some improvement. They may not seem “broken,” but these variables might be underperforming based on expectations. Not loving some elements of your blog design? Unsure if your email CTAs are hitting the mark? Put them on the list for some experimentation after your fires are put out.
- Create a testing rotation for the things that work well. You might be thinking, “If it’s not broken, why test it?” Audience behavior and digital algorithms and other variables change all the time. Maintaining a regular testing schedule can help you get ahead of issues. Plus you might be able to bump up the conversion rate on your posts by testing something as simple as publishing time – and every percentage point helps, especially at scale.
We’ve considered 26 of the most effective content marketing A/B tests to run:
Content Creation
- Headlines
We’ve talked a lot about the importance of headlines and recommended tools like CoSchedule’s headline analyzer to improve yours.
They’re also one of the elements you should be testing. Once you have enough volume of posts published, you could use a tool like BuzzSumo to see what kinds of headlines perform well on your site. You can use this information to build your test.
Try testing short vs. long, including a number vs. no number, negative words vs. no negative words – the possibilities are nearly endless.
- Blog length
Another oft-split tested variable is the length of your posts.
For instance, here at Audience Ops, we aim for posts of between 1000 and 2000 words (ideally, about 1200-1500) based on what we know about our audience and the likelihood posts of that length will be shared. Some posts end up longer than 2000 words (typically yours truly as the guilty party…), but our BuzzSumo data shows that we’re not necessarily getting more shares for the extra length.
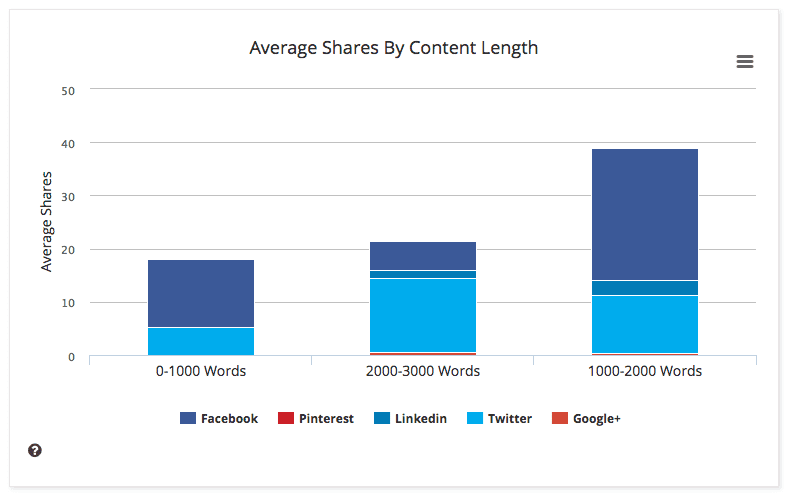
Of course, there’s plenty more variables to test, including traffic, scroll depth, conversions, and more, but this is a variable worth testing because it affects how you spend your content creation time.
- Copywriting
Here are just a few of the ways you could set up A/B tests to improve your copywriting:
- Using “my” vs. “your”
- “Negative” words vs. “Positive” words
- Casual tone vs. more formal tone
- Shorter sentences and paragraphs vs. longer
- More subheads and formatting vs. less
The trick with testing for copywriting is to create two identical pieces of content and only change the element you’re testing. Otherwise copywriting can be quite subjective and difficult to attribute.
- CTA copy
- CTA location
- CTA types
We’ve discussed before how copy, location, and type of call to action can have an outsized effect on how well they work to convince people to take action.
Some of the most commonly tested elements for CTAs include:
- Button colors
- Buttons vs. graphic vs. in-text
- Font sizes and colors for in-text CTAs
- How the copy addresses the user (or not)
- Sentiment, such as emotional appeal vs. appeal to fear of missing out
- Size of the CTA
- Images
Prevailing conventional wisdom tells us that the answer is always “Yes, images,” when considering whether or not to include images in your content. Images help to break up copy so the brain can process better, and generally look better.
But remember that there’s no “right way” for your content operation. Influential marketer Seth Godin writes posts that are exactly as long as he wants them to be (often quite short) and include no images at all. It’s clearly working for him!
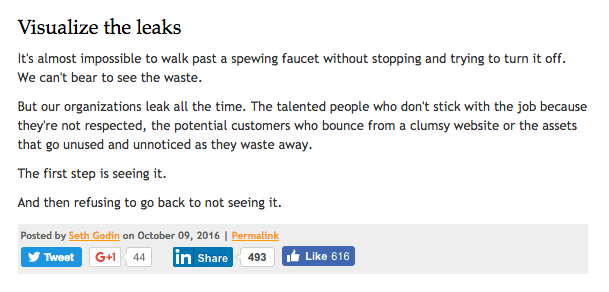
Source: Seth Godin’s blog
- Copy vs. infographics
Sometimes, an image really is worth a thousand words. If you regularly explain processes or complex ideas – or if you just think your topic lends itself to visuals – consider split testing engagement levels if you turn an entire section of your blog into an infographic.
Content Optimization
- Search headlines
Many content marketers create a different headline for search results than the one that appears at the top of a post. This helps align with keyword phrases and also give marketers a chance to make the regular headline more engaging, while the search engine results page (SERP) headline might be more informative. This practice also gives you a second set of headlines to A/B test for effectiveness.
- Meta descriptions
Meta descriptions are the short, informational paragraphs you see published under search results that tell you what you’ll get if you click on that result. Typically no longer than ~150 characters, these are perfect examples of microcopy – short copy that needs to pack a big punch. If you have high-volume search traffic, testing the kinds of meta descriptions that get more clicks can help you draw in even more traffic.
- Days/times of the week to publish
Many marketers instinctively publish on weekdays, thinking that business-related content will most often be consumed during business hours. It’s a fine hunch, and probably true for some businesses, but this variable is worth testing.
For instance, Neil Patel wrote about TrackMaven, who found that they saw way more social shares on the weekend than during the week, even though their posting frequency was half of what it was during the week.
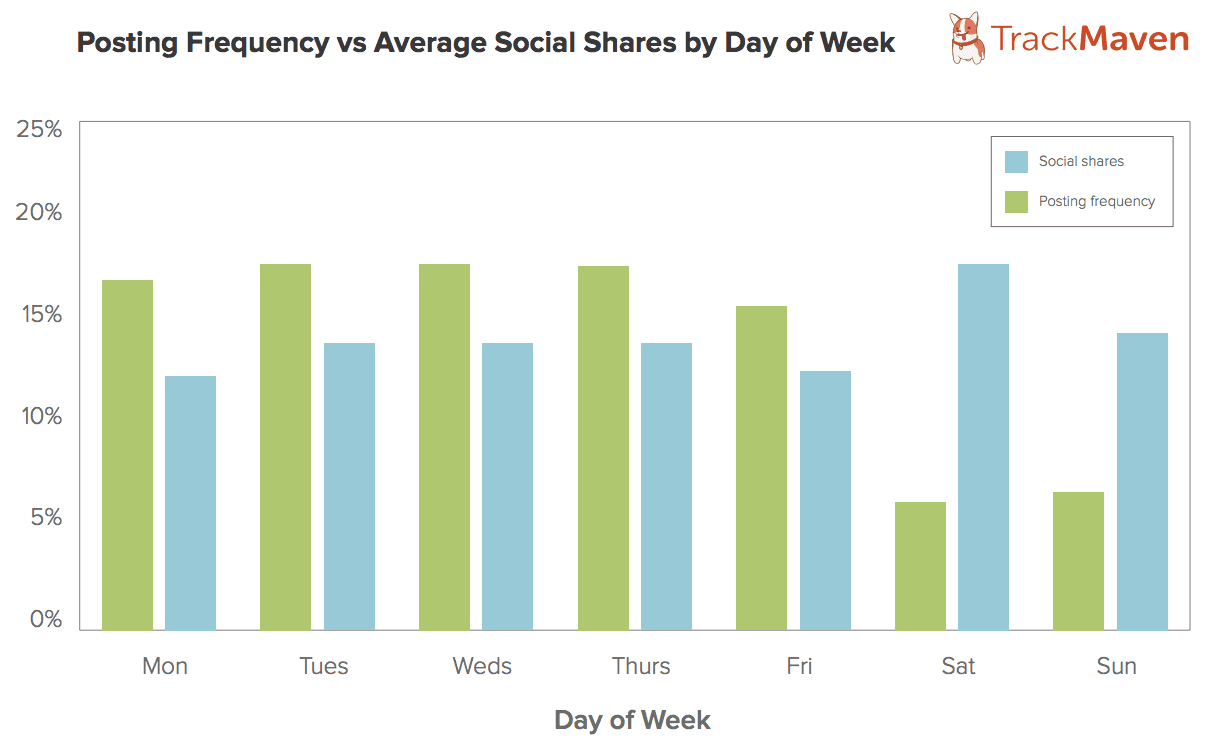
Of course, this won’t be everyone’s graph – but with the possibility of results like that, it’s worth testing to see if weekend publishing could boost engagement, or to see which day of the week you should save your best content for.
- Content upgrade teaser copy
Most post-level content upgrades come in a few forms: checklists, guides, additional information, lists, and similar. If you’re seeing a lot of subscriptions coming from your lead magnets/content upgrades, it’s probably worth your time to find out if certain types of promotional copy performs better than others with your audience.
For instance, here at Audience Ops, we write a blurb about the content upgrade for each post:
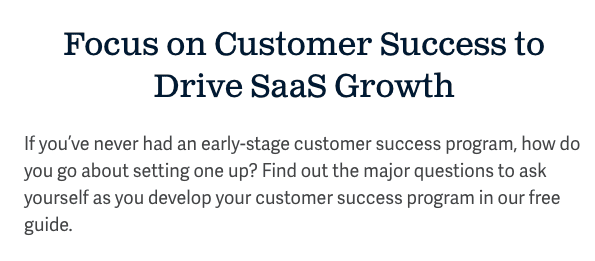
We could split test whether longer or shorter summaries worked better, as well as optimize the language we used (more action-oriented vs. using questions, etc.)
Web and Blog Design
- Hero images
Many sites today use large images as the backdrop for landing pages, or large hero shots as the headers for each blog post. It’s a good idea generally, once you have enough traffic, to test whether your web and/or blog design helps or hinders your visitors in getting the information they want.
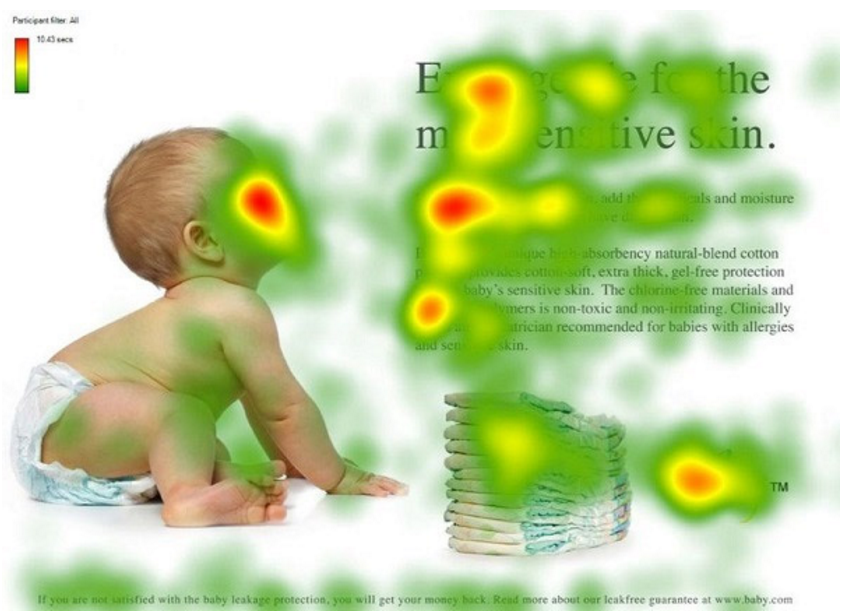
Test whether hero shots work or what kinds of images connect best with your viewer. For instance, Kissmetrics used the example of heatmapping on a baby skincare page – one where the baby faced the viewer, and one where the baby faced the page copy.
In the first example, most people focused on the baby’s face because it was looking at the viewer. The second example drew more eyes toward the page copy:
- Font sizes and colors
This is pretty self-explanatory but also important. Humans respond to color and visuals, and your site’s dominant palette could color (pun intended!) your visitors’ feelings toward your brand. Switching up the overall light vs. dark or accent colors of your site, or the types and sizes of fonts you’re using, could change the way prospects view your products.
- Summaries
Do you provide a quick blurb about each post on the main blog page? Do you also provide a quick summary of what you can expect to learn inside a post, right at the top? Both are easily tested variants that could contribute to more clicks and also more engagement once your visitor is reading the post.
Email Marketing
- Subject lines
Subject lines are crucial to getting people to understand what an email is when it lands in their inbox, and also to see the value proposition in actually opening it.
When we create email courses for our clients, we sometimes work with them to A/B test different headline types when we’re not sure what’s going to connect best with their audience. Some of the variables we test include:
- Playful vs. serious
- Questions vs. statements
- “My” vs. “Your”
- Labeled lesson numbers vs. unlabeled
- Brand name in subject line vs. unbranded
- Conversational vs. more formal
- Personalization fields
Some emails you get will address you by name – others won’t. This is another thing you can test to see if personalization gives you an edge in how people engage with your emails. Personalization reminds viewers of how they’ve already interacted with your brand, perhaps including items they looked at before, or letting them know that if they liked X article, they might also like Y.
- Email lengths and structure
Should you send a three-column, image-laden, fully branded email to your list? Or just a three-paragraph “normal” email? There’s so many options for how to structure your email, especially with the built-in design tools many email marketing platforms offer. This is something you should test, as length and structure definitely affect how well people can engage with your email.
- Email send times
Hunter analyzed 9 different data-rich studies to try to determine the “right” time to send an email. Here’s what they found about the least-ideal times to sent an email: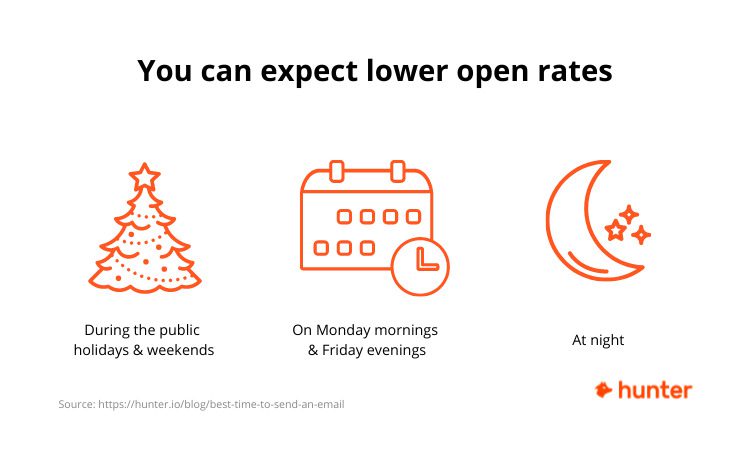
Using data like the article shares, you can run tests to determine ideal send time(s) for your audience, which should be pretty easy to tun in most email marketing platforms.
- Images in email or text-only
Emails can be constructed in many different ways. You’ve probably seen everything from a highly designed visual newsletter to a text-only email. Some companies send roundups and newsletters that take a while to scroll through, complete with jump links. Others send emails that require nary a scroll inside your inbox.
We like to use brief, text-based emails to get the word out about new blog posts, because we want our community focused on the words and the ideas – and to highlight our single post link. But it’s worth testing to figure out if adding an image would improve or harm your conversions.
- Email CTAs
These can be A/B tested just like any other CTA. Where should you put them? Should they be colorful or not? Text-only? An image? What kind of copy works? All of this can be split tested to your heart’s content.
- Tone
Just like any copywriting, email can take on a very distinct tone that some may come to associate with your brand. Testing what tone gives readers confidence and prompts them to click on your CTA will give you a template for how to handle everything from email marketing to customer communications.
I especially love receiving emails from Drift. They’ve completely nailed the conversational, “hey, just thought I’d show you something cool” tone that also characterizes all of their company copy – and they arrived there through testing:
- “From” line
Does it make a difference if the “From” line reads “Claire from Audience Ops” or just “Audience Ops” or just “Claire Karjalainen”? Maybe…maybe not. You’ll never know unless you test, and the “From” line is another part of email marketing that can help add confidence. You’re overcoming a hurdle to get people to open your emails and then another one to get them to read – might as well look for every advantage you can get!
Other Marketing Tests
- Days/times/frequency of social promotion posts
Social scheduling company Buffer wrote the book on social testing, and produced an infographic showing the best times to post and how often after analyzing their vast troves of social data. This kind of benchmark testing works great as a guideline for what you can expect, but nothing will work as well as split testing your own hypotheses about your social channels once you have enough engagement to make the test worthwhile.
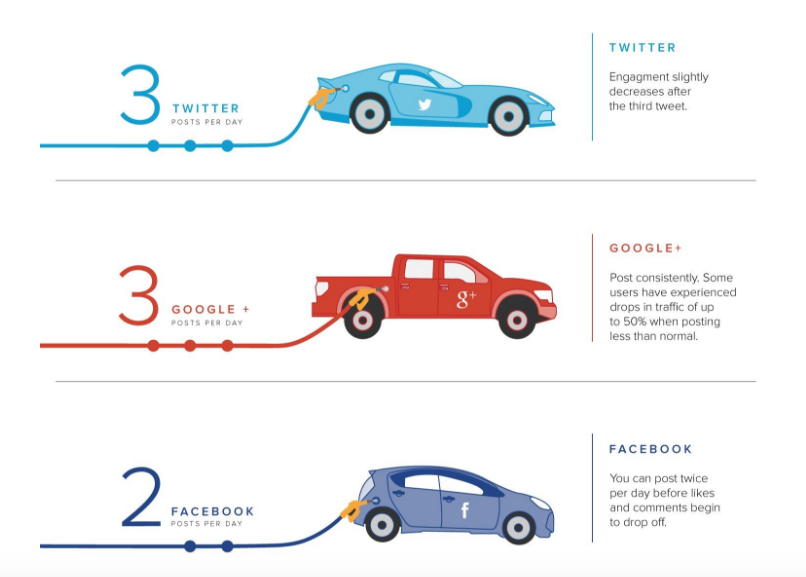
Source: Buffer
- Images with social posts
The data on the question, “Should we include images in our social posts?” points to “Yes!” For instance, when Buffer tested their own prolific social accounts, their test looked like this (blue is “With Images”):
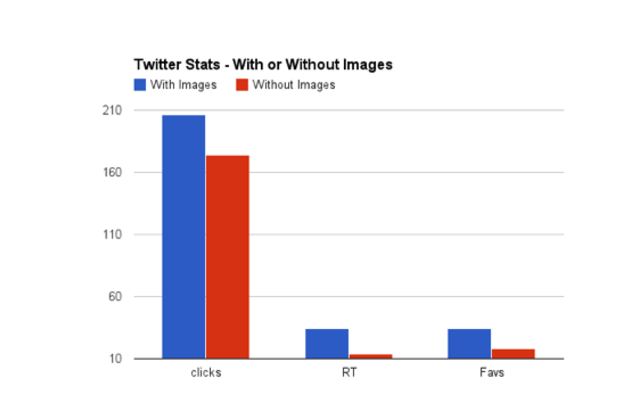
But you’re not Buffer or anyone else – your audience is yours and your social channels are yours. So if you’re wondering how to identify incremental performance enhancers or detractors like “with image” or “without image,” A/B testing your social posts is the way to go.
- All inbound channels
Your leads come from lots of different channels, but not all of those leads will be created equal, and not all of those channels will be either.
Drift’s lead marketer Dave Gerhardt tweeted this screenshot showing SlideShare’s dominance in terms of driving email signups:
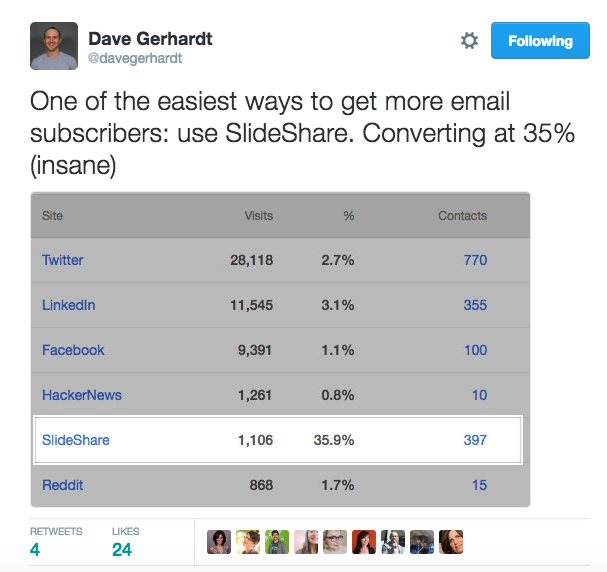
The follow-up testing to that kind of data could be to find out whether SlideShare drives better leads (with higher lifetime value that could represent better fit and loyalty), or to test some of the messages or tactics that work for SlideShare on other channels.
What to Do with Insights from Your Tests
A/B testing can help you eke out small wins or skyrocket conversions with big ones. A/B testing can also be incredibly frustrating and produce unconvincing or statistically unsound results that end up nearly useless to you.
Like a scientist, you should be careful drawing too broad of a conclusion from any one test. Even if your sample size was enormous and statistically significant, and even if your testing proved beyond a doubt that A is better than B, always remember:
You need to relate your data back to human behavior.
To quote the Double Rainbow Guy, “What does it meeeeeaaan?” when your visitors “pick” one headline over another? Are you truly proving that users want you to be a more positive than negative in your headline copy? Did you manage to separate your test enough from other factors that could affect that choice?
Perhaps the result of an email marketing send time split test consistently shows 9% more opens by sending on Tuesday. Now you need to make that statistic mean something in terms of your strategy. What will you send on Tuesdays? How will you turn 9% more opens into some percentage more clickthroughs?
The mindset of contextualizing your results and not looking at them in a vacuum will help you make your test results meaningful beyond the face-value data.
Interested in working with savvy content marketers who are always thinking about how to optimize your blog articles? Let’s chat about how we write, publish, and promote posts just like this one for busy founders. Just pick a time here, and we’ll call you!