Many content marketers treat images as second-class citizens, investing in little more than stock photos. While custom visuals might make for a better user experience, search engines couldn’t index them, and they didn’t directly translate to an increase in page views. This made it difficult for marketing teams to increase their budget and invest in images – that is, until several trends helped push them in the right direction.
Why Your Content Needs Images
Three important trends have made custom visuals extremely important for content marketers:
- Image-centric social media networks, like Pinterest, Instagram, and Snapchat, have been growing at a much faster pace than Facebook or Twitter.
- The popularity of content marketing has made it more difficult than ever to rank for desirable keywords and generate inbound search traffic.
- The measure of success for online marketing has transitioned from page views to more relevant metrics, like email conversion rates or sales conversion rates.
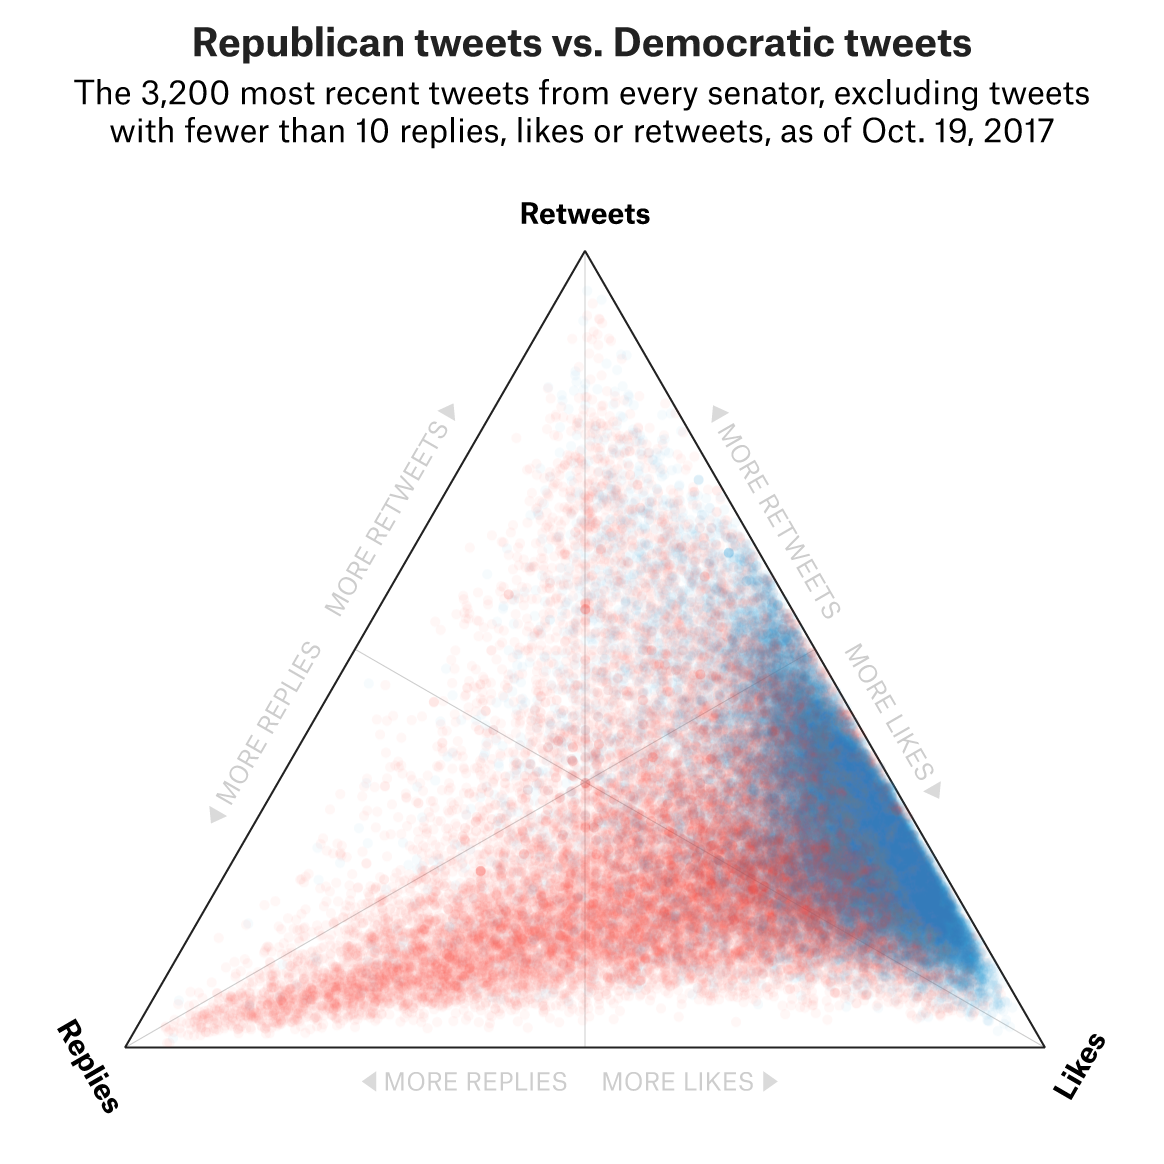
Content marketers have started to invest heavily in custom visuals to capitalize on these trends. While visual bloat continues to annoy visitors, Nielsen Normal Group eye tracking studies have shown that readers spend more time looking at relevant images than they do reading text. The key is including information-carrying images rather than purely decorative images. The inclusion of these images can help set a piece of content apart from the competition.
Note: Eyes are drawn to informational image, but not stock photo.
There are also more tangible benefits when it comes to generating page views from social media. Buffer found that tweets with an image associated with them received 150% more retweets than those without images. BuzzSumo found that Facebook posts with images have 2.3 times more engagement than those without images. With more than half of B2B marketers prioritizing visual content assets, there’s also greater competition ahead.
How to Make Compelling Images
The good news is that the cost of producing information-carrying images has dramatically fallen over the past several years. In the past, content marketers had to mine their own data and use programming languages like Python or JavaScript/D3 to create visualizations. These days, you can find millions of facts and statistics on Statista and create compelling infographics using a drag-and-drop editor in your web browser of choice.
There are two popular types of information-containing images:
- Infographics are visual representation of a concept that makes it easy to understand. For example, CreativeBloq.com put together an infographic showing desk workers exactly how to do ten essential exercises using their chair.
- Data visualizations are typically more complex charts that make it easier to visually consume data that may be complicated to read on a page. FiveThirtyEight is a popular website that uses data visualizations to enhance their content.
Many different online tools have sprung up in recent years to make it easier than ever to design infographics and data visualizations. Canva is the most popular option, but Piktochart, Easel.ly, and several other companies offer similar tools. Many of these companies provide a free trial to get started and offer premium features for a monthly subscription. If you’re making custom images for each post, these subscriptions are often well worth the money.
Those looking for more complex data visualizations or a completely hands-off process may want to consider hiring a contractor on Fiverr or Upwork. Contractors charge different prices based on whether the graphics are completely customized, and whether the data behind the graphic is provided or must be researched. It helps to shop around to find the contractor that best suits your businesses’ needs and long-term goals.
In general, the best data visualizations and infographics drive home the content’s core message and contain information that’s not necessarily common knowledge.
How to Promote Images
The first step in promoting visual assets is making sure that they’re setup to appear in search engines. Moz, a popular SEO consulting firm, recommends optimizing the file name, HTML ALT attribute, image caption, surrounding text, page title, page URL, image dimensions, image size, and the SEO attributes of the page that the images are embedded within. Image popularity – that is, how many times it’s embedded elsewhere – may also play a role.
The next step is ensuring that the images are properly setup on a technical level to be shared via social media. Using the Open Graph protocol, web developers can specify how a piece of content should appear in social media, including what image(s) should be displayed. These properties are defined in HTML meta tags in the head of each page, but WordPress plugins like WPSSO make it easy to define custom images for each post and insert these tags automatically.
The most popular meta tags to include are:
<meta property="og:image" content="http://website.com/path-to-image.png">

<meta property="twitter:image" content="http://website.com/path-to-image.png">
It should also be very easy for a visitor to share an image that they may see within an article. As with Open Graph, there are many WordPress plugins that make it easy to automate the process of making images shareable in the actual content, such as Monarch Social Sharing. The goal is to have a “Pin This” or “Tweet This” icon next to each image to incentivize sharing.
Finally, you may also want to consider building backlinks to your custom visuals by posting them on websites like Quora or cold emailing websites that may be covering a similar topic. The key to effectively executing this strategy is delivering real value to the other person. Authors receive spam emails every day pitching infographics and Quora has started to see issues with advertorial-themed posts and you don’t want to fall into these categories.
An example of a cold email might be:
Hi [name],
I noticed that you recently wrote an article covering [topic]. I really enjoyed [part of article] and [part of article]. We recently shared your article with our [number] followers on [social media network].
I wrote about the same topic in a recent blog post [link]. As part of our research, we created a data visualization that shows [explanation]. We have received a lot of positive feedback from readers and I thought you might be interested in including it within your article. I have attached the graphic to this email in case you’re interested.
I hope to continue reading great content from [website] and let me know if you would like to collaborate on anything down the road.
Thank you,
[Your name]
The email should make it clear that you’ve actually read the author’s article (which you really should have) and provide them with some immediate goodwill by sharing it with your followers. Next, you should make it as easy as possible for the person to post the graphic by attaching it to the email and leave the door open to a follow-up.
The Bottom Line
Images have become increasingly important in content marketing, but they’re not all created the same. Just like text-based content marketing, it’s important to deliver real value to readers and spend time promoting the content to get the message across. This article provides you with everything you need to start including custom visuals in your content to increase its helpfulness to the reader, ensure widespread sharing, and ultimately drive leads to your business.
